How To Read A Psychrometric Chart
Psychrometrics is the science of moist air thermodynamics (the effects of heat, work, and energy on a system) in relation to HVAC systems. A phychrometric chart is helpful for determining what combination of heating, cooling, humidifying, and dehumidifying sources should be used to reach optimal environmental conditions in facilities.
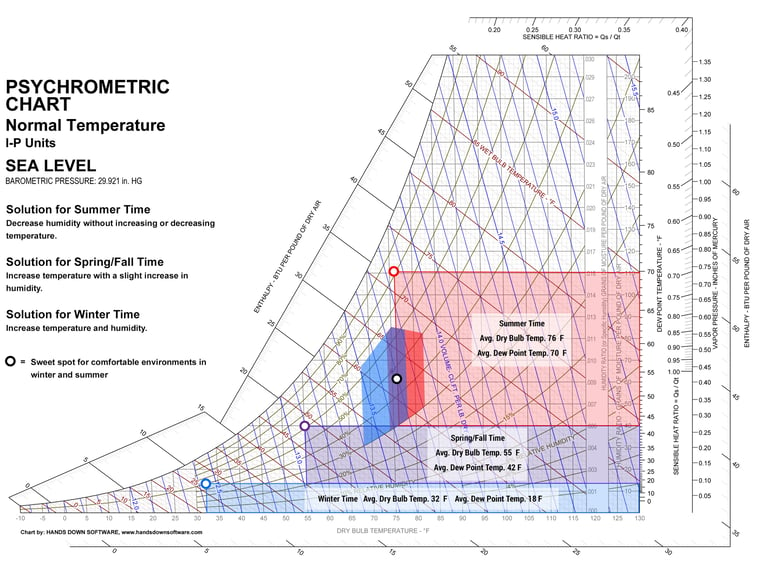
At the end of this post, I have an example of how to use a psychrometric chart to plot seasonal weather changes in relation to our desired "Comfort Zone." This will tell us what we need to do to offset the effects of outside weather conditions to bring us to our desired zone. First, lets take a look at the different parts.
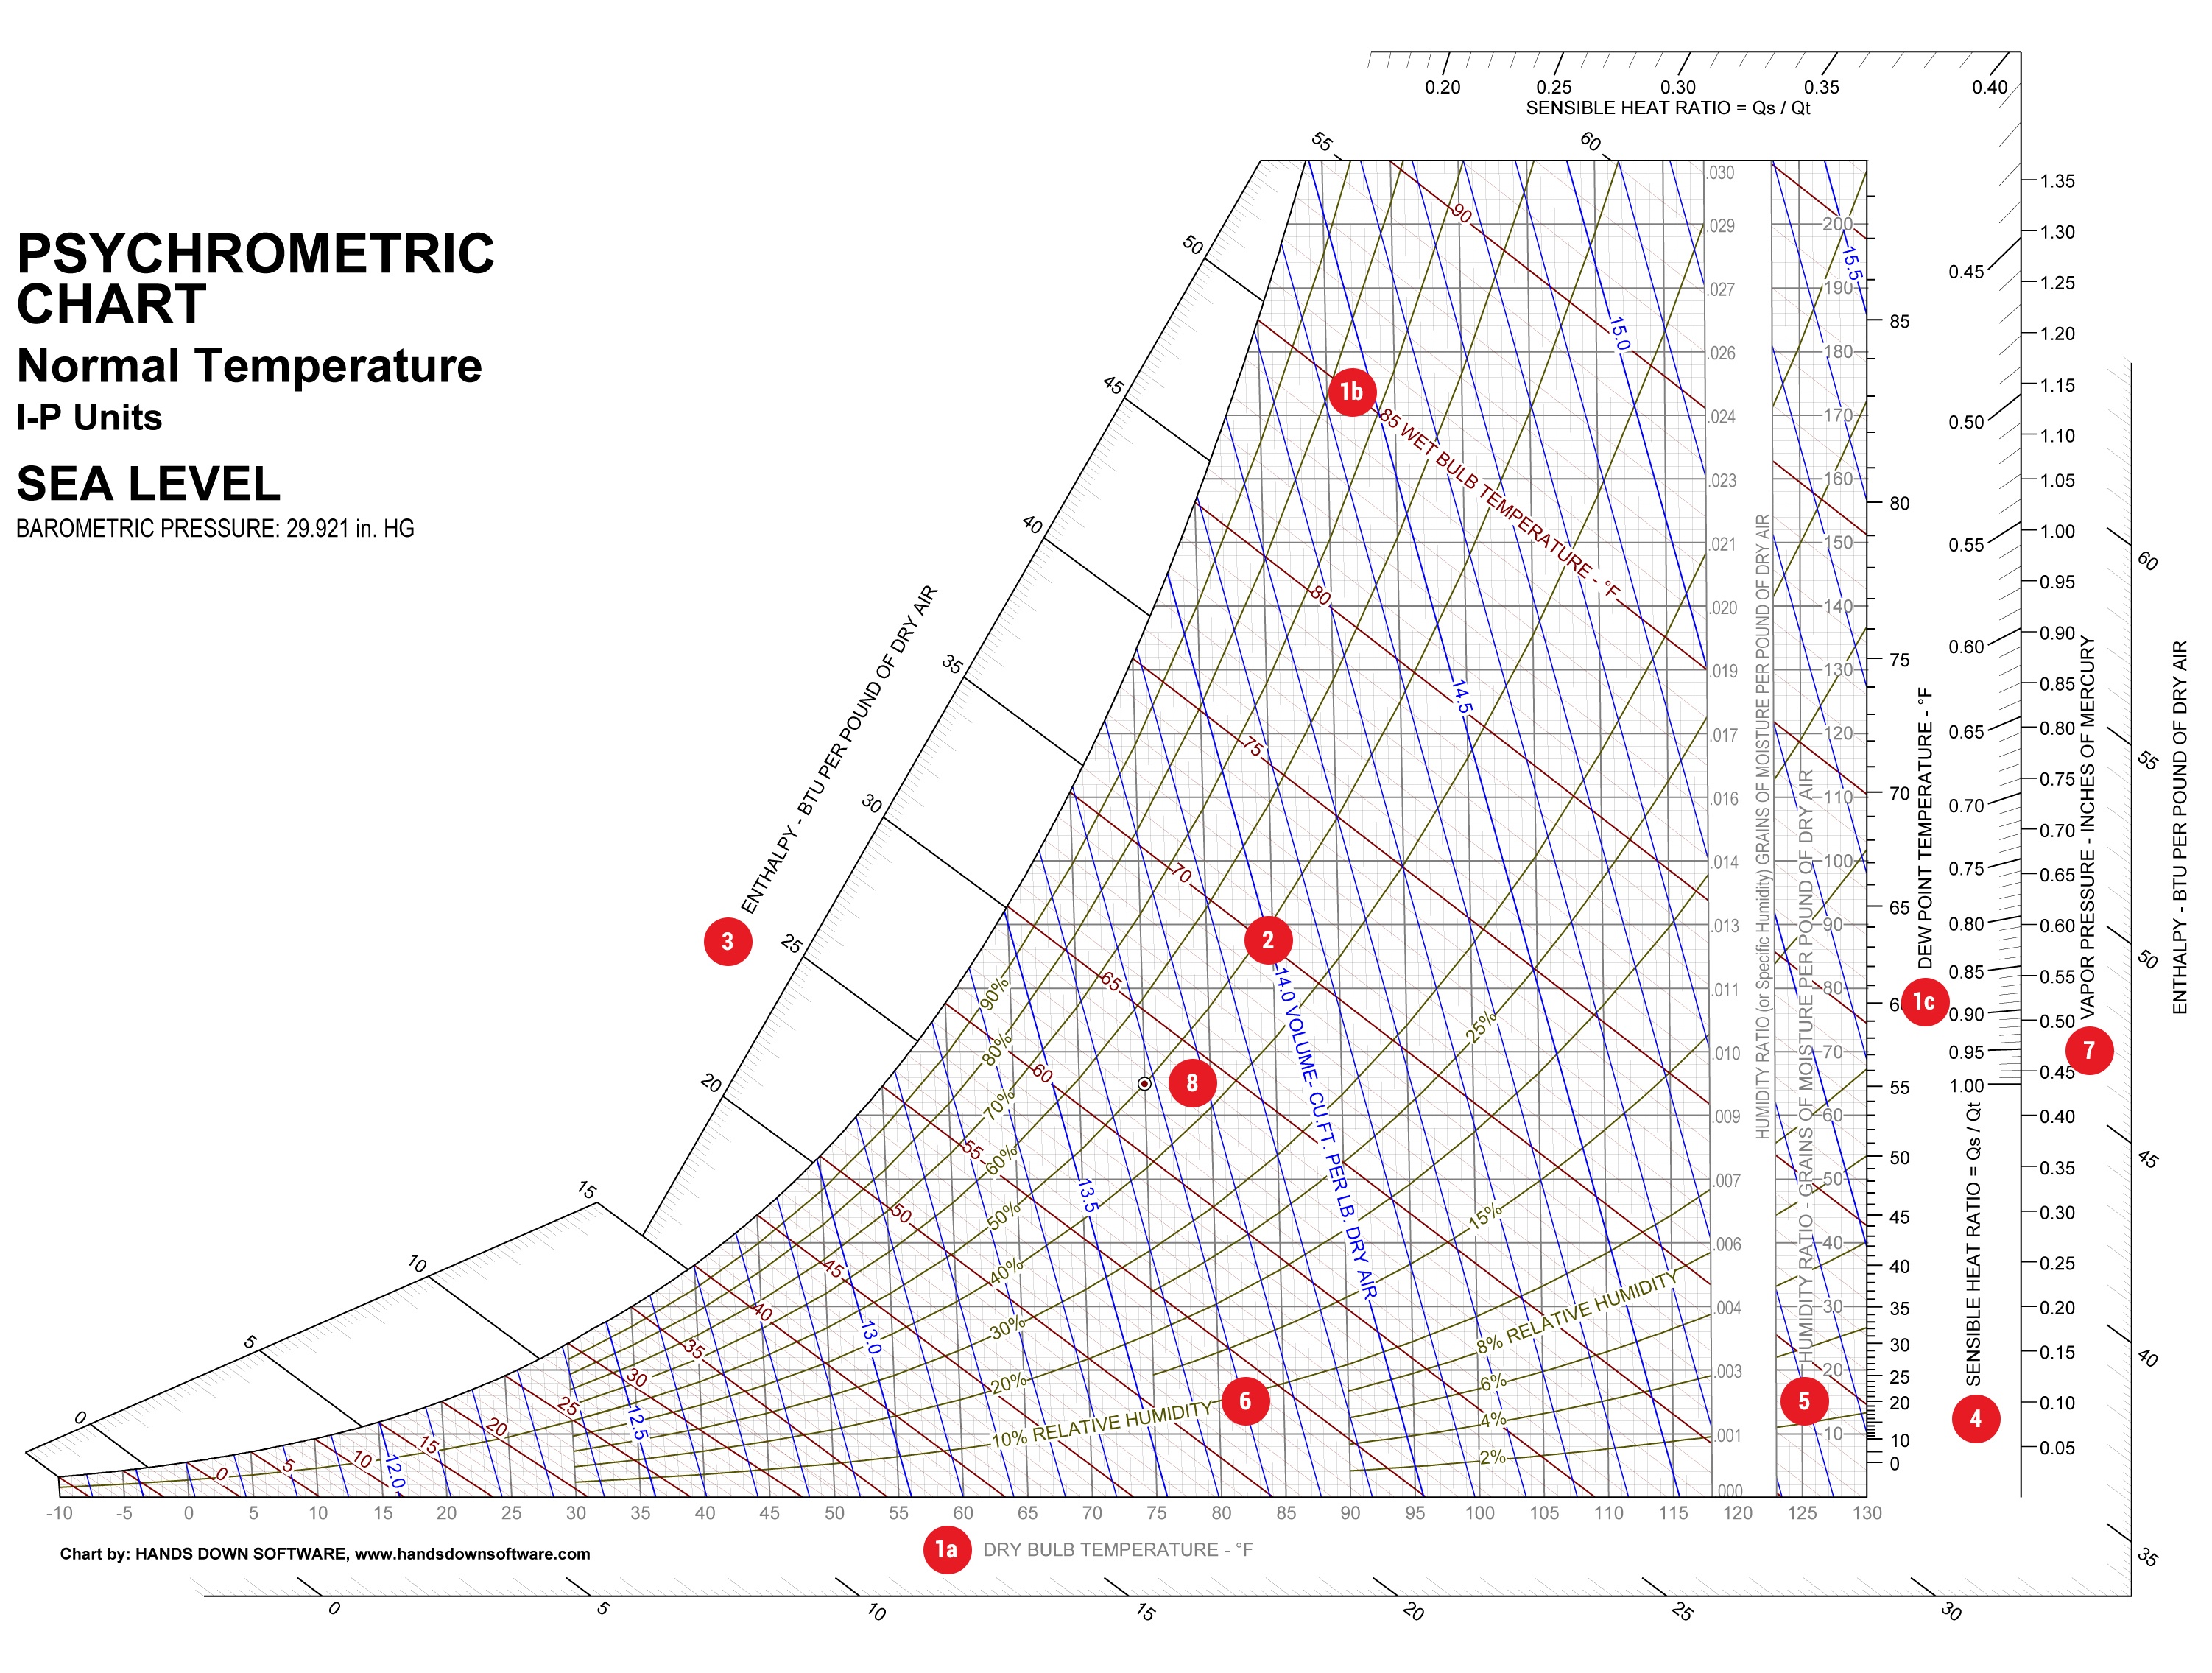
Parts of a Psychrometric Chart

(click chart to expand)
1. Temperatures
a. Dry Bulb (DB) - is the temperature reading on a standard thermometer. Psychrometric charts are available in the following approximate dry bulb temperature ranges:
low temperatures: -20°FDB to 50°FDB,
normal temperatures: 20°FDB to 100°FDB
high temperatures from 60°FDB to 250°FDB
b. Wet Bulb (WB) - is the temperature reading on a standard thermometer when the sensing bulb is being covered with a wet wick or sock and exposed to air flow to trigger evaporation.
c. Dew Point - is the temperature at which moisture starts to condense from the air.
2. Specific Volume and Density
Air specific volume is measured in cubic feet per pound (ft³/lb). This is essentially the amount of space air occupies per pound of weight. The denser the air (humid air vs. dry air) the lower the specific volume.
3. Enthalpy
Enthalpy is the measure of heat energy (represented by the variable "h"). The difference in the total heat of air before and after flowing through a heating or cooling coil is a change in enthalpy. Enthalpy is expressed in Btu (British thermal unit) per pound of dry air.
4. Sensible Heat Ratio
The Sensible Heat Ratio (SHR) is the total sensible heat flow divided by the total heat flow (sensible + latent). Sensible heat flow causes temperature change in a substance, in this case air, without changing the moisture content of the air. Latent heat flow causes a change in the moisture content of air, without causing the air temperature to change. A typical change would be when air condensates (turns from a gas to a liquid). Condensation begins when specific heat is removed from the air causing the air temperature to reach the dew point.
Sensible Heat Flow = 60(specific heat of air in Btu/lb ºF (0.24 at 72ºF))(density of air in lb/ft³)(air flow in ft³/min)(| supply air temperature - conditioned room temperature |)
Latent Heat Flow = 60(latent heat of vaporization of water in Btu/lb (970 at sea level))(density of air in lb/ft³)(air flow in ft³/min)(humidity ratio difference in lb water/lb dry air)
The links above go to tools to help calculate the variables for your facility. Different geographic regions could change the value of some variables.
5. Moisture Content
Moisture content (a.k.a humidity ratio) is the total weight of water vapor per pound of dry air. Moisture content is typically measured in grains/lb (1 grain = 0.000142857 lbs) and represents the specific humidity of air.
6. Relative Humidity
Relative humidity (RH) is the percentage of water vapor per pound of dry air relative to how much the air can hold at its current temperature. The hotter the air, the more water vapor it can hold. Maintaining a relative humidity between 30 - 65% is optimal for most facilities. More about relative humidity and occupant environments.
7. Vapor Pressure
Vapor pressure is the pressure exerted by water vapor in air and is measured in inches of mercury (in Hg).
8. Standard Air Dot
The standard air dot is a marker on the psychrometric chart that indicates the measurement for standard air. Standard air is typically 70ºF with a relative humidity of 54% and 60 gr/lb of specific humidity.
Using a Psychrometric Chart
Here is the example I mentioned at the beginning of this post using New York State weather conditions. Seasonal dry bulb and dew point temperature averages are plotted in relation to the "Comfort Zone." Comfort zones will be different from facility to facility but this gives a general area where the temperature is between 68 and 82ºF with a relative humidity range of 30 - 65%. Plotting averages for each month would result in more precise solutions. Use https://weatherspark.com/ to find weather statistics for your location.
(click chart to expand)
More helpful articles from Q Ware.
Ryan Noble
Ryan is Q Ware's Marketing Specialist.
